
Your Student Information System holds a lot of information about how your school is operating. Enrollment, attendance, grades, programs, courses, student accounts, and other records are being updated every day.
Standard SIS reports can answer many day-to-day questions. But what happens when you want to combine that information, look for trends over time, or build dashboards around the specific metrics your school cares about?
That's where a data warehouse and business intelligence tools such as Microsoft Power BI can help.
What is a data warehouse?
A data warehouse makes information from your SIS available in a structure designed for reporting and analysis.
Instead of working directly with the operational database that powers your SIS, your reporting tools connect to a separate set of organized data.
For example, ampEducator's Data Warehouse provides 17 simplified tables covering key areas of the SIS. The data is refreshed nightly, so schools can analyze recent information without their reporting activity interfering with everyday SIS operations.
From there, the data can be connected to tools such as Power BI to create your own reports and dashboards.
What could you actually report on?
This is where a data warehouse becomes particularly useful.
Instead of starting with an existing report and seeing what information it contains, you can start with a question your school wants to answer.
For example:
Enrollment
How has enrollment changed from one session to another?
Which programs are growing?
How many students are currently active in each program?
Student success
Are attendance rates changing over time?
Which students or courses are showing lower attendance?
How do academic results compare across programs or sessions?
Finance
What is the school's current outstanding student balance?
How are balances distributed across programs?
How have payments or outstanding balances changed over time?
The exact dashboards will depend on the information your school wants to monitor.
Turn rows of data into something easier to understand
Having access to data doesn't automatically make it useful.
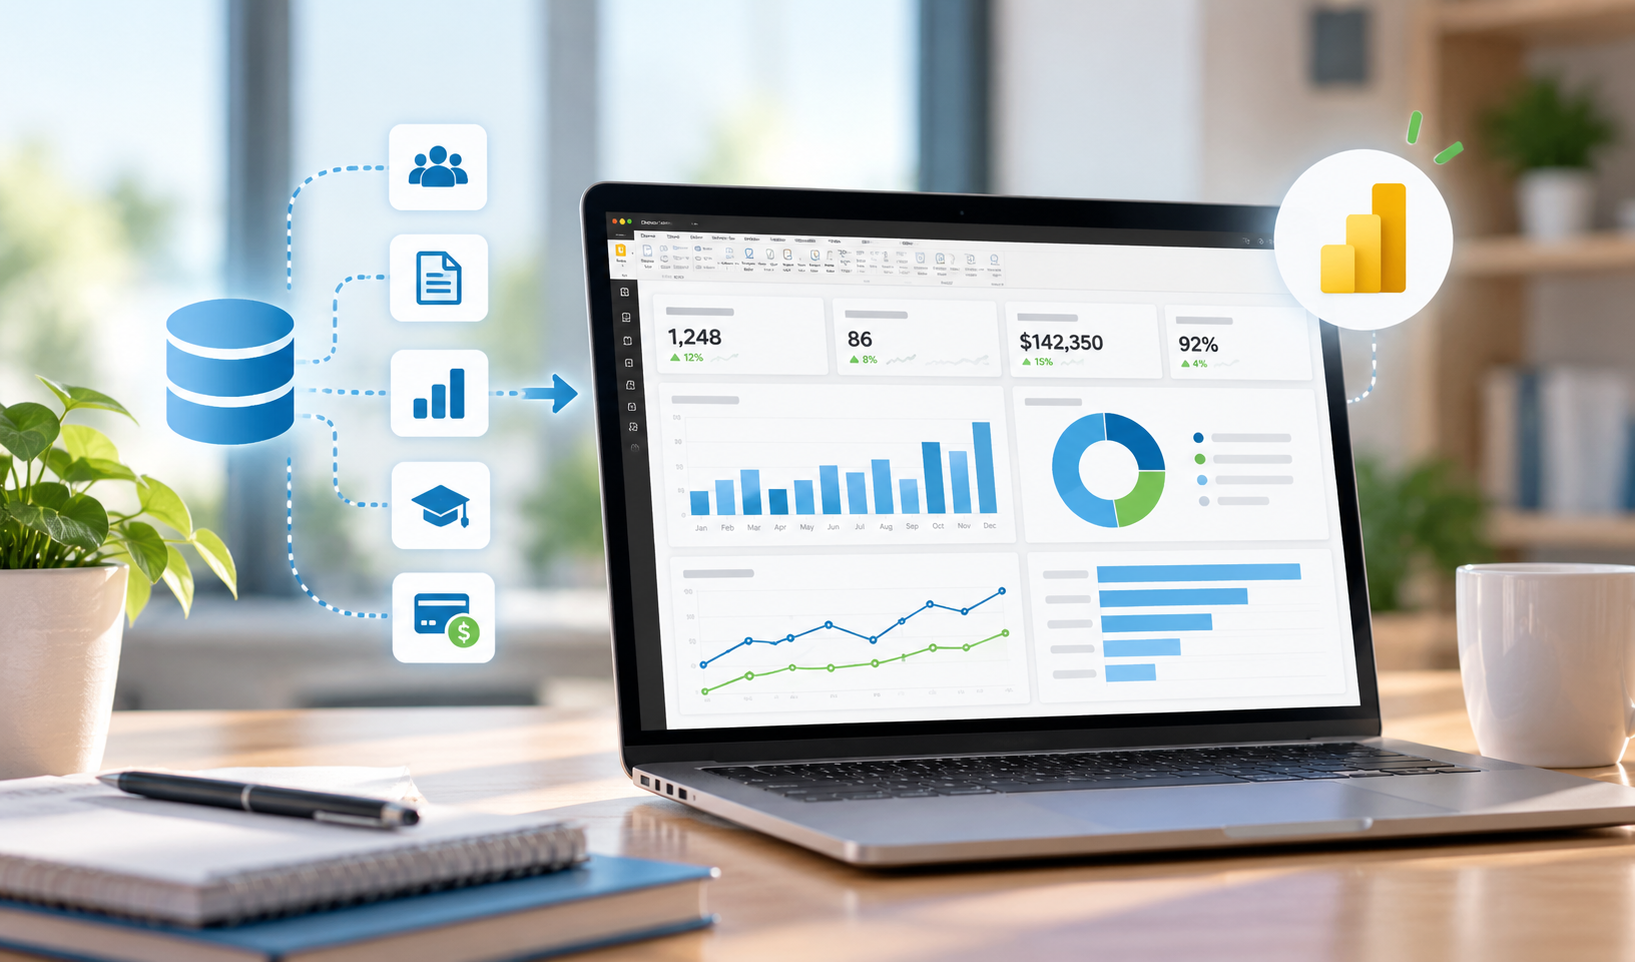
A report with hundreds of rows may contain the answer you're looking for, but identifying patterns can still take time. Power BI and similar business intelligence tools allow that same information to be presented through charts, KPIs, filters, and interactive dashboards.
A student success dashboard, for example, could bring together enrollment, academic, and attendance information. Instead of reviewing those areas separately, staff could use one dashboard to look for trends or areas that may require attention.
A finance dashboard could provide a high-level view of balances and payments, with filters that allow the user to explore a particular program, session, or period.
Build different views for different teams
One advantage of working with a reporting tool is that not everyone needs to see the data in the same way.
A registrar may be interested in enrollment and program completion. Academic staff may want to focus on grades and attendance. Finance teams may care about balances and payments, while leadership may want a smaller number of high-level indicators.
Rather than creating one report that tries to answer every question, schools can create dashboards around different responsibilities and priorities.
Your reports can evolve with your questions
The questions a school asks today may not be the questions it asks next year.
Once your SIS data is available through a data warehouse, your reporting isn't limited to a fixed collection of dashboards. As priorities change, you can create new reports, add different visualizations, or explore the data from another perspective.
That makes the data warehouse less about producing a single report and more about giving your school a foundation for ongoing analysis.
Make more of the data you already have
Schools don't necessarily need to collect more data. Often, the opportunity is to make better use of the information they're already collecting.
ampEducator's Data Warehouse provides access to 17 simplified tables with a nightly data refresh and can be used with external reporting and business intelligence tools such as Microsoft Power BI.
That gives schools another way to move beyond individual records and standard reports and start exploring the bigger questions behind their data.